Showing posts with label Economic Analysis. Show all posts

Wednesday, May 25, 2011

Greek Commissioner warns about leaving euro

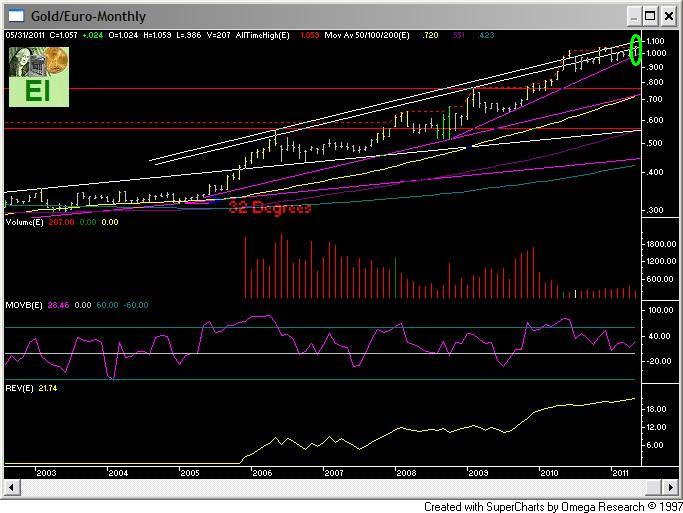
Capital anticipates while politicians talk of possibilities. Euro gold at new highs reflects capital voting with their feet about the future of the EU. The same can be said for U.S. dollar gold.

Euro Gold:


A Greek EU Commissioner warned that the country's participation in the euro was under threat, though the prime minister insisted Wednesday his government would see through new austerity measures and keep Greece in the joint currency.

The EU's Fisheries Commissioner, Greece's Maria Damanaki, warned that "The scenario of removing Greece from the euro is now on the table."

"I am obliged to speak openly. We have a historical responsibility to see the dilemma clearly: either we agree with our borrowers on a program of tough sacrifices with results ... or we return to the drachma," she said in a statement on her personal website.

Tuesday, May 24, 2011

Words of Wisdom Found Within The Daily Noise

Great observations form Dow Theory Letter’s Richard Russell,

Last Saturday Faye and I had coffee at the Pannikin, one of our local coffeehouses. A cup of decaf sells for two dollars. The place was busy with people eating lunch, talking or just drinking coffee. I asked Faye, "Does this look like people are cutting back because of the Great Recession?" Faye shook her head, "Hardly," she smiled.

I reminisced, the Great Depression ended around 1942. That was about 60 years ago. Three or four generations have elapsed since 1942. So it's been three or four generations since Americans have experienced what I call "hard times." Only old codgers like Richard Russell remember what it was like during the Great Depression. Those were the days when people clung to every nickel and dime they could scrape together.

In 1940, if I wanted some coffee, I probably already had it in the thermos bottle that I was cramped into my lunch box. Or I could go to the nearest drug store or maybe to an Automat and buy a cup of coffee for a nickel. Actually, I'd probably prefer Woolworth's because there coffee was always a nickel, and there'd be no charge for "refills" (as many as you wanted).

It occurred to me sitting there with Faye at the Pannikin coffee house that people today have no idea or concept of cutting back and saving money. Here were kids buying cups of coffee for two dollars a cup and ordering sandwiches or salads for 5 to 8 dollars a pop. "Well," I thought, "If the government isn't cutting back, why should the people? It's the way of the world today." But I have this feeling, this creepy feeling, that it isn't going to last. Somewhere ahead I believe the Great Recession could turn in to the second Great Depression.

Russell, a prolific straight shooter, nails it. The distinction between the Great Recession and Depression is mostly semantics. Another great trading box, similar to that of 1873, 1929, and 1971, formed in 2000. This suggests that real (constant currency) stock prices and standard of livings have been falling since 2000. It will take decades before the 2000 highs are breached to the upside.

Russell’s observation suggests that most of the public remains oblivious to the reality that excessive debt-based consumption is dead. A public weaned on reality-based television and bubble gum economic analysis is always the last to know. Russell’s pragmatic observations be viewed as prophetic anyone willing to study history after 2025. I say why wait to send him compliments? He’s right today.

U.S. Large Cap Total Return Index (LCSTRI); S&P 500 Total Return Index to Gold Ratio

Wednesday, May 18, 2011

Fed considers tighter credit as economy improves

Key word here is considers. Debate and action are two separate issues. Enacting policies to tighten credit while recent data reveals a broad based contraction would be politically unwise.

The Federal Reserve last month began debating how it should start reversing policies that pumped billions of dollars into the economy during the recession. Some members said the Fed might need to start boosting interest rates this year to guard against inflation.

Fed policymakers didn't commit to taking any action at the April 26-27 meeting, according to minutes released Wednesday. But they agreed the economy was improving and if that continued the Fed would need to remove its massive to prevent consumer prices from getting out of control.

A majority of participants said the best method for tightening credit would be to lift the federal funds rate, which is now at a record low near zero. The federal funds rate is the interest banks pay each other on overnight loans. Raising that rate would likely precede sales of mortgages or Treasury securities in its vast portfolio.

Source: finance.yahoo.com

Monday, May 16, 2011

Unusual Credit Trends In Commercial Banking

Fractional reserve banking is like a shark, credit must continue to expand (swim) or it faces death. This explains the unprecedented panic, as reflected by the speed and magnitude of the coordinated quantitative easing, to unclog the credit markets and restart lending process.

Credit creation is clearly stumbling. Commercial banks are beginning to hoard cash and treasury securities while critical sub sectors such real estate (including home equity) and consumer loans’ contribution to total bank credit continues to shrink. The red boxes below illustrate new swing lows in their percentage contributions since the onset of the crisis in 2008.

Why are commercial banks still aggressively hoarding cash assets (equivalents) and treasury despite the end of the Great Recession in 2009? Perhaps, there’s more or less to this economic recovery than advertised.

Total Bank Credit, All Commercial Banks.

Thursday, May 12, 2011

Dr. Copper? More Like Dr. Liquidity

"Dr. Copper" is one of most over-hyped economic indicators out there. The real economic is far too complex to be simplified into follow Dr. Copper. Besides, copper like stocks, industrial and agricultural commodities are being driven more by Dr. Liquidity than supply and demand dynamics. Copper’s real trend looks a lot different than its nominal (fiat money) trend. Those that adhere to the Dr. Copper theory better be able to distinguish the difference between the two trends.

The nominal trend broke above the 2008 high in 2011.

USD Copper ETN (Nominal)


The real, constant current trend, paints a completely different picture. Real price remain well below the 2008 high. Why? Liquidity is driving copper more than supply and demand fundamentals. Don't look for the angle to get pushed much as 2012 approaches. This explanation lacks voter appeal.

Oz Copper ETN (Real)


Headline: Why Copper Is the Metal to Watch

In recent weeks, metals of all sorts--precious and industrial--have taken a beating in a major selloff in the commodities market. Experts cite a number of reasons, including speculation, increased margin requirements (how much collateral investors have to put down), and concerns that the economic recovery may not be as strong as previously thought. But experts say the losses in copper are the most troubling.

While scarce precious metals like gold and silver are often perceived as safe havens or inflation hedges because of their inherent value, copper is an industrial metal that's seen as a leading indicator for the future of global economic growth. It's often called "Dr. Copper" because of its past success in forecasting the direction of the economy.

"Oftentimes, the price action in copper indicates what's going on in the global economy because it's used so much for so many industrial purposes," including electrical wiring, says Sean Brodrick, small-cap and natural resource analyst for the blog Uncommon Wisdom Daily. "The breakdown we're seeing in copper right now looks quite ominous."

Source: finance.yahoo.com

Fundamentals: Money Out > Money In

The sell off in gold and silver is nothing more than a transfer of control from weak to strong hands. These markets will turn, unexpectedly so in the headlines, once the paper fuel has been exhausted and concentration of funds emerges.

Why?

The fundamentals debt and socialism, thus, gold and silver have not changed. For example, yesterday's federal budget reveals that heavily hyped spending cuts proposals are merely crumbs of a very large and growing deficit pie.

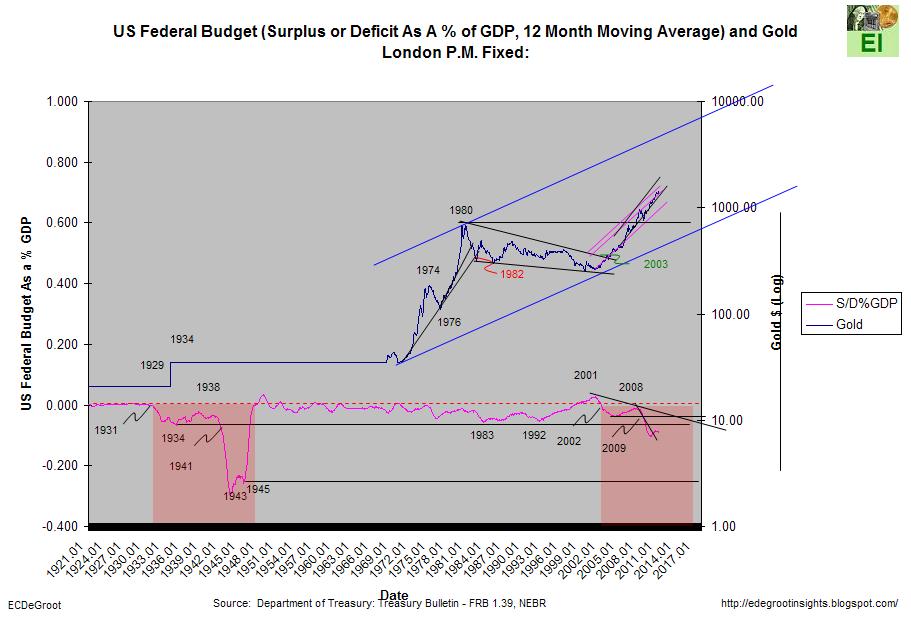
Jim's formula illustrates yet another rollover within a secular downtrend. This rollover will be addressed with classic lip service, but behind the scenes massive, largely quiet, liquidity injections will be the solution.

US Federal Budget (Surplus or Deficit As A % of GDP, 12 Month Moving Average) and Gold London P.M. Fixed:


Real (constant currency) revenues or the money government receives to pay the bills, continue to contract faster than real outlays. In other words, the government, like the post office is hemorrhaging red ink.

Real or Gold Adjusted Federal Total Receipts 12-Month Moving Average (TR12MA) AND Federal Total Receipts 12-Month Moving Average Year-over-Year Change (TW12MA12LN)


Real or Gold Adjusted Federal Total Outlays 12-Month Moving Average (TO12MA) AND Federal Total Outlays 12-Month Moving Average Year-over-Year Change (TW12MA12LN)


As Jim has said numerous times, gold is all about debt (and the solutions to mitigate it). Deficit spending cannot be cut without Depressionary consequences, so it won’t. History suggests that governments pay their bill through devaluation rather than discipline. The chart below illustrates only a portion of those bills; the appropriate expression should be GASP! This is why capital is buying gold.

Total Credit Market Debt As A% GDP


Headline: Spending cuts not expected to dent $1.5T deficit

The $38 billion in spending cuts agreed to last week won't prevent this year's budget deficit from setting another record high, estimated at $1.5 trillion.

Most of the agreed-to spending cuts either affect future budgets or amount to accounting gimmicks that won't reduce actual spending.

The Treasury Department reported Tuesday that the deficit already totals $829.4 billion through the first six months of the budget year -- a figure that until 2009 would have been the biggest ever for an entire year. For March alone, the government ran a deficit of $188 billion.

Source: finance.yahoo.com
Source: fms.treas.gov

Wednesday, May 11, 2011

US house price drop accelerates

Long-term readers should not be shocked by this news. The real estate decline began as a slow motion train wreck in 2001. It picked up speed in 2005. The trend in real, currency adjusted prices, illustrates the both past, present, and future pain in this heavily-hyped market. Market forces will continue to pressure housing into the cyclical low still years away, but an unsuspecting public won’t likely accept it until near the end.

History is repeating, but few recognize it. As a result, history repeats and the public finds itself shocked by these seemingly ‘new’ and unusual events.

U.S. Median Home Price (MHP) And MHP to Gold Ratio


S&P Homebuilders Index (HB) AND HB to U.S. Median Home Price (HBMHPR)


Headline: US house price drop accelerates

US house prices have suffered their biggest quarterly fall since the collapse of Lehman Brothers, underlining the scale of the headwinds still facing the world's biggest economy.

Average house prices slumped 3pc in the first three months of this year, a decline that pushed the number of homeowners in negative equity – where a mortgage is higher than the value of a property – to 28pc from 22pc a year earlier, according to new research from Zillow, a major US property website.

Source: telegraph.co.uk

Thanks Bob!

Tuesday, May 10, 2011

There's No 'Money' Gene

The vast majority of the headline analysis about oil implies the recovery in price since 2009 has been a direct result of rising demand from the economic recovery. The sharp rebound, however, is largely currency induced. While the slow upward drift in the ‘real’ (ounces of gold) price suggests demand outstripping supply over the long-term, its muted rebound reveals the influence of currency devaluation on US dollar prices over this period. In other words, the sharp rally fanning the nation’s fear over rising gasoline prices has more to do with excessive money creation than market fundamentals or CME margin increases.

Does this distinction matter? Is there a difference between night and day? Although human DNA is encoded by millions of years of evolution that helps discriminate the difference between night and day, science has yet to find the ‘money’ gene. This is why the cycle of boom and bust regularly repeats within the game of money and capitalism.

West Texas Intermediate Crude Oil (OIL) AND Oil to Gold Ratio (OILGLDR):


Headline: Crude Oil Futures Drop on CME Margin Increase, Projected U.S. Supply Gain

Crude oil dropped in New York after CME Group Inc. raised margins and on speculation U.S. stockpiles increased to near the highest level in two years.

Oil fell as much as 2.4 percent after the exchange late yesterday increased the amount of money traders must hold as collateral for their crude, gasoline and heating oil transactions, effective after the close of business today. The Energy Department will probably report tomorrow that supplies rose last week, according to a Bloomberg News survey.

“The market tumbled hard on news that the CME was raising margins,” said Addison Armstrong, director of market research at Tradition Energy in Stamford, Connecticut. “We’re up from the day’s lows because of strength in the equity markets.”

Friday, May 6, 2011

Labor Report Review

While the economy is adding jobs, it's still not a strong recovery. Job creation has been largely limited to the service sector of the economy.

Birth/Death Model (BDM) Contribution to Nonfarm Net Payrolls (NFP) Added/(Lost)


An up trend break of job growth in trucking and warehousing, a sub sector of the labor report, would confirm further economic weakness.

Truckers and Warehousing Payroll And YOY Change


The civilian labor force has been steadily contracting year-over-year since 2009. Can headline job creation suggest an improving employment picture as long as labor force continues to shrink?

Civilian Labor Force (CLF) And Year-Over-Year (YOY) Change


Headline: Economy adds 244k jobs, rate ticks up to 9 pct.

Employers added more than 200,000 jobs in April for the third straight month, the biggest hiring spree in five years. But the unemployment rate ticked up to 9 percent.

The Labor Department reported Friday that the economy added 244,000 jobs last month. Private employers shrugged off high gas prices and created 268,000 jobs -- the most since February 2006.

Source: finance.yahoo.com

Wednesday, May 4, 2011

A Picture of Currency Induced Cost Push Inflation

Acceleration phases in the ISM's prices paid to PMI ratio illustrate currency induced cost push inflation quite well.

ISM Prices Paid Index (PP) to National Purchasing Manager's Index (PMI) Ratio:


Observations:
(1) The recent up tick in the ratio is part of greater acceleration that began in 2008.
(2) While the up tick has caught the public attention, i.e. pain of higher gas and food prices, it’s hardly statistically extended. History has shown us that market forces are notorious for pressing ‘pain’ well beyond the comfort zone.
(3) History also suggests that the amplitude of acceleration phases will increase over time. For example, the growing size of the spikes from 1966, 1970, 1974, and 1980. A similar pattern is beginning to reveal itself with little media attention.

Source: ism.ws

Monday, May 2, 2011

Gold to Silver Ratio (GSR)

Morning Observations:

(1) Critical support tends to be tested as resistance.
(2) Silver has become an explosive market.
(3) The lower magnet is not done pulling.

Gold to Silver Ratio (GSR), Monthly Average Price:

Personal Consumption Continues to Soar

Personal consumption as a percentage of gross domestic product (GDP) has risen to an all-time high to 71.2%. The US economy continues to be a debt-based, consumption driven economy. The great consumption trend of 1981 and bubble of 2000 has yet to pop. In other words, nothing has changed.

Personal Consumption Expenditures (PCE) As A %GDP and Personal Consumption Expenditures As A %GDP Average from 1947


Headline: Dollar Weakens, Treasuries Gain as U.S. GDP Growth Slows; Stocks Advance

The Dollar Index slid to the lowest level since 2008, Treasuries rose and gold rallied to a record after economic growth slowed. The Standard & Poor’s 500 Index climbed an almost three-year high as rising earnings and takeovers overshadowed the report on gross domestic product.

The Dollar Index tumbled 0.6 percent at 4:10 p.m. New York time after slumping to 72.871, an almost three-year low. It declined for an eighth straight day, its longest slump since 2009. Ten-year Treasury yields lost five basis points to 3.31 percent, gold jumped as much as 1.4 percent to $1,538.80 an ounce and silver rose for a second day. The S&P 500 climbed 0.4 percent to 1,360.48 while the Russell 2000 Index of smaller U.S. stocks rallied to a record for a second straight day.

Source: bloomberg.com

Friday, April 29, 2011

Does A Rising Trend Suggest Real Estate Is Prospering?

No.

A rising nominal trend does not necessary suggest prosperity during periods of aggressive currency devaluation. Dow Jones Equity REIT to Gold ratio, the true message of the market, suggests replacing prospering with struggling. Smart money never shorts an asset denominated in devaluing currency without a hedge. In other words, short the weak asset and buy the strong. There’s no better hedge for currency devaluation than gold.

DJ Equity REIT to Gold Ratio:


This is what "Smart Money" is doing, who would have thought anything Real estate could be prospering? another question for how long ?

another question is "how smart am I", I would have shorted this a long time ago and lost the jewels, another question "how smart is smart money?

Bob

Real Estate iShares (IYR)

Chart: stockcharts.com

Thursday, April 28, 2011

Increasing Austerity Programs Will Extend QE

The trend towards smaller government, i.e. austerity programs, is not limited to the European Union. While the media may downplay similar problems in the US union, they have not gone unnoticed by capital. As goes austerity, so goes the size of quantitative easing needed to minimize its effects.

Headlines: Philly Plans To Lay Off Nearly 4,000 Teachers And School Workers

State budget cuts will force Philadelphia's schools to lay off 3,820 employees - including 12% of the district's teacher - to close a gaping budget shortfall next year, the Philadelphia Inquirer reports.

The Philadelphia School District - which has about 155,000 students - faces a $292 million loss in state aid next year, the result of Pennsylvania Gov. Tom Corbett's proposed $1.1 billion cut in the state's education budget.


Source: businessinsider.com

Don't Blame the Weather

Liqudity-driven recovery pushes nominal economic data and equities higher.

For example,

Chicago Fed National Activity Index (CNFAI) and S&P 500 Average


The real economy, however, paints a picture of a struggling expansion.

For example,

Real Business Core Capital Spending: Real or CPI-Adjusted New Orders of Durable Goods ex. defense and aircraft (RBCCS) and YOY Change


Gold-Adjusted New Orders of Durable Goods ex. defense and aircraft (BCCSGLDR) and YOY Change


The labor market continues to ebb and flow within the cycle. Gold already 'knows' a change is coming.

Average Weekly Initial Claims State Unemployment (AWIC) And YOY Change


Headline: Stocks waver on weak reports on GDP, jobs

Stocks were narrowly mixed Thursday after the government said the U.S. economy slowed in the first three months of this year.

The economy grew at a 1.8 percent annual rate in the January-March period. That's the weakest showing since last spring when the European debt crisis reduced growth to 1.7 percent. Higher prices for oil and gas have constrained consumer spending.

The government also reported that more people applied for unemployment benefits for the first time last week. The increase, the second in three weeks, suggests that the job market remains sluggish.

Source: news.yahoo.com

The Game Is Changing As The Waterfall Decline Intensifies

Ex post analysis (after the fact) is always easier than ex ante. Unfortunately, often cited retrospective analysis doesn’t help investors anticipate the big and profitable events. Investors with vision anticipate and survive; those without react and perish.

Fractal analysis reveals multiple waterfall declines in the dollar since 1970. Today’s acceleration of the decline, in particular, has the potential to instill ‘the fear of God’ for those unprotected.

Purchasing Power of the USD


U.S. Dollar Major Currencies Index


Do not underestimated what people like Jim Sinclair, Dan Norcini, and James Turk (see below) are saying. The backwardation in silver remains persistent and pronounced despite the recent rally. This suggests heavy demand for physical silver. In addition, connected money continues to cover their shorts into the teeth of the rally. These two events are highly unusual and suggest growing strain in the silver market. If gold begins to display a similar setup, the unfolding waterfall decline will intensify quickly.

Silver London P.M Fixed and the Commercial Traders COT Futures and Options ZScore Weighted Average of Long & Short As A % of Open Interest


Headline: James Turk - The Waterfall Decline in the US Dollar Has Begun

With gold and silver taking off after the Fed statement, today King World News interviewed James Turk out of Spain. When asked about the action Turk stated, “I've just finished reading the Federal Reserve's announcement of its meeting concluded earlier today. I've also scanned some of the excerpts from Bernanke's press conference and Eric, I am struck by the inconsistencies. The precious metals markets must be seeing it the same way I am given the strength in gold and silver after the announcement's release.”

The Dollar Index has broken below all of its previous lows except for the last one at roughly 71 on the index. When that gives way you could see incredible panic selling ensue.

The bottom line is the market is calling the Fed's bluff. Investors don't believe the Fed will stop its purchases of US government debt on June 30th and for what it is worth, I don't either.”

Source: kingworldnews.com

From Bob

Wednesday, April 27, 2011

Case Says U.S. Housing Already Experienced `Double Dip'

The trends illustrated below support Karl Case's growing concern about real estate.

U.S. Median Home Price (MHP) And MHP to Gold Ratio:


S&P Homebuilders Index (HB) AND HB to Gold Ratio:


S&P Homebuilders Index (HB) AND HB to U.S. Median Home Price (HBMHPR):


Bottom line, QE will continue either direct or indirect despite the talk of withdrawal.

Economist Karl Case:

'In a sense, We've already had a double-dip [in housing].'

'We've always been able to count on new households coming into the market; they're not coming.'

'There's going to be a lot of dislocation when Fannie and Freddie evolve into something new.'

'Housing starts are at sixty-year lows, and they've been there for 33 months.'


From Bob

Tuesday, April 26, 2011

Constant Currency Dow Transportation Better Represents the 'Real' Economy

Higher stock prices, driven by liquidity (currency devaluation), support the premise of a solid economic recovery. The transportation stocks (transports), like small cap stocks, have always been more sensitive to liquidity. The computer buy programs will chase even harder when the transports push to new highs in the near future. New nominal highs, however, means little in a world driven by currency devaluation. The downward trend in the constant currency transport index provides a better assessment of the 'real', clearly struggling economy.

Dow Jones Transportation Average (DJTA) AND DJTA to Gold Ratio (DJTAGOLDR):

Friday, April 22, 2011

A Comparison of 1931-1936 and 2008-2013

Real (constant currency) federal total receipts continue to contract as the federal budget (Jim's Formula) rolls over. This vicious cycle is characteristic of a Great Depression (or Recession). Vicious cycles are highly dependent on liquidity (quantitative easing) to maintain economic activity and support an ongoing debt collapse. Another downward leg of the Great Recession will resume when TIME is right.

Real or Gold Adjusted Federal Total Receipts 12-Month Moving Average (TR12MA) AND Federal Total Receipts 12-Month Moving Average Year-over-Year Change (TW12MA12LN):


US Federal Budget (Surplus or Deficit As A % of GDP, 12 Month Moving Average) and Gold London P.M. Fixed:


Headline: U.S. households getting more from Uncle Sam than they pay in

With President Obama’s deficit-reduction plan now on the table, the political left, right and center are ready to rumble over how to assure long-term fiscal stability. The big questions are where to slash and by how much. But over the next year or two, the most important question for the economy might well be how quickly the cutting should begin. Households have become unusually dependent on the government for income support and removing that prop too fast could put the recovery at risk.

For the first time since the Great Depression, households are receiving more income from the government than they are paying the government in taxes. The combination of more cash from various programs, called transfer payments, and lower taxes has been a double-barreled boost to consumers’ buying power, while also blowing a hole in the deficit. The 1930s offer a cautionary tale: The only other time government income support exceeded taxes paid was from 1931 to 1936. That trend reversed in 1936, after a recovery was underway, and the economy fell back into a second leg of recession during 1937 and 1938.

Source: money.msn.com

From Bob

Tuesday, April 19, 2011

Cash Assets of Commercial Banks Are Soaring

The following table continues to reflect continued weakness in commercial bank lending. Particularly alarming is the sharp rise in cash assets as a percent of total bank credit (Cash%TBC). The blue arrow reveals that CASH%TBC is approaching 16%. This is the highest level since the onset (acceleration) of the debt crisis in 2008. This is an immediate attention grabber. Commercial banks are hoarding cash assets. $1495 golden question is why and why now? Gold and silver, often inaccurately portrayed as relics of past monetary systems, are in response to reality and rational decision making.

Joe Walsh once wrote in the song Good Man Down, "Well it’s hard to keep a good man down." Gold is today's good man.

Total Bank Credit of Commercial Banks in the United States:


Source: federalreserve.gov