Showing posts with label Technical Analysis. Show all posts

Wednesday, May 25, 2011

Greek Commissioner warns about leaving euro

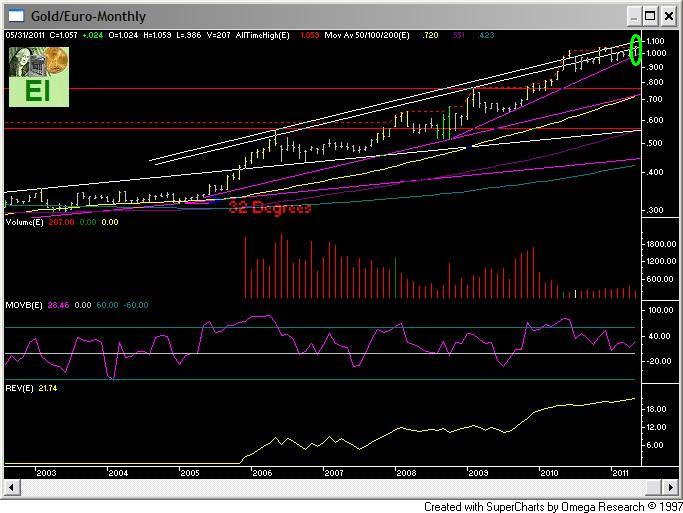
Capital anticipates while politicians talk of possibilities. Euro gold at new highs reflects capital voting with their feet about the future of the EU. The same can be said for U.S. dollar gold.

Euro Gold:


A Greek EU Commissioner warned that the country's participation in the euro was under threat, though the prime minister insisted Wednesday his government would see through new austerity measures and keep Greece in the joint currency.

The EU's Fisheries Commissioner, Greece's Maria Damanaki, warned that "The scenario of removing Greece from the euro is now on the table."

"I am obliged to speak openly. We have a historical responsibility to see the dilemma clearly: either we agree with our borrowers on a program of tough sacrifices with results ... or we return to the drachma," she said in a statement on her personal website.

Bearish Setup In U.S. Dollar Underway

Bullish setups in gold, silver, stocks, and commodities are confirmed by a bearish count (setup) in the U.S. dollar.

Ignore the newswire and follow the money.

U.S. Dollar Index and the Commercial Traders COT Futures and Options Stochastic Weighted Average of Net Long As A % of Open Interest


The long-term chart provides a better perspective of downside targets and forces.

U.S. Dollar Index

Tuesday, May 24, 2011

Things Not As They Appear In Equities

Flavor-of-the-day experts cite "Sell in May and Go Away" trading logic as the motivation for turning bearish.

My personal rebuttal to this argument would be hogwash!

Retail money, chronic tail chasers, has become increasing bearish into weakness (see table below). This counter-intuitive, negative swing in sentiment is bullish.

AAII Survey


A detail study of market internals also supports the bullish thesis. Statistical concentration of breadth, as illustrated by the red painted stick, tends to be generated at or near tradable bottoms.

NYSE Composition and Breadth Analysis:


Let’s not forget the bullish money flows into stocks.

Words of Wisdom Found Within The Daily Noise

Great observations form Dow Theory Letter’s Richard Russell,

Last Saturday Faye and I had coffee at the Pannikin, one of our local coffeehouses. A cup of decaf sells for two dollars. The place was busy with people eating lunch, talking or just drinking coffee. I asked Faye, "Does this look like people are cutting back because of the Great Recession?" Faye shook her head, "Hardly," she smiled.

I reminisced, the Great Depression ended around 1942. That was about 60 years ago. Three or four generations have elapsed since 1942. So it's been three or four generations since Americans have experienced what I call "hard times." Only old codgers like Richard Russell remember what it was like during the Great Depression. Those were the days when people clung to every nickel and dime they could scrape together.

In 1940, if I wanted some coffee, I probably already had it in the thermos bottle that I was cramped into my lunch box. Or I could go to the nearest drug store or maybe to an Automat and buy a cup of coffee for a nickel. Actually, I'd probably prefer Woolworth's because there coffee was always a nickel, and there'd be no charge for "refills" (as many as you wanted).

It occurred to me sitting there with Faye at the Pannikin coffee house that people today have no idea or concept of cutting back and saving money. Here were kids buying cups of coffee for two dollars a cup and ordering sandwiches or salads for 5 to 8 dollars a pop. "Well," I thought, "If the government isn't cutting back, why should the people? It's the way of the world today." But I have this feeling, this creepy feeling, that it isn't going to last. Somewhere ahead I believe the Great Recession could turn in to the second Great Depression.

Russell, a prolific straight shooter, nails it. The distinction between the Great Recession and Depression is mostly semantics. Another great trading box, similar to that of 1873, 1929, and 1971, formed in 2000. This suggests that real (constant currency) stock prices and standard of livings have been falling since 2000. It will take decades before the 2000 highs are breached to the upside.

Russell’s observation suggests that most of the public remains oblivious to the reality that excessive debt-based consumption is dead. A public weaned on reality-based television and bubble gum economic analysis is always the last to know. Russell’s pragmatic observations be viewed as prophetic anyone willing to study history after 2025. I say why wait to send him compliments? He’s right today.

U.S. Large Cap Total Return Index (LCSTRI); S&P 500 Total Return Index to Gold Ratio

Monday, May 23, 2011

Empty Your Pockets With A Handshake And Smile

If you feel like a dog chasing its tail in gold, silver, even stocks, it’s time for a new strategy. Certain players will empty your pockets while you shake their hand in gratitude for 'good' information. You’re either a buyer or seller. Fence sitters make for easy targets.

Russell 2000 (IWM) and the Commercial (C) Less Nonreportable (NR) Traders COT Futures And Options Stochastic Weighted Average of Net Long As A % of Open Interest


SP 500 And Equity Diffusion Index (DI)


Sell in May and go away? Unfortunately, the game is not that simple.

Headline: Stocks: 'Sell in May' likely to continue

Investors have taken the old Wall Street adage of "Sell in May, then go away" to heart this year, and the stock market's slump is likely to persist during the last week of the month.

The Dow (INDU), S&P 500 (SPX) and the Nasdaq (COMP) have each lost more than 2% during the past three weeks, pressured by the latest round of economic and corporate news, which are suggesting that the economic recovery may be slowing.

355Print Last week, reports on housing starts and existing home sales came in weaker than expected, and regional manufacturing activity slowed to the lowest level since October.

Source: money.cnn.com

Sunday, May 22, 2011

The Correlation Between Gold and Gold Stocks Breathes Over The Short-Term

Thanks for sharing Noah

The only opinion that matters is the message of the market. The market is bullish on gold and miners. This means I am bullish on gold and miners until that message changes.

TA’s “three taps and out” has been complete. This suggests that the breakout is already underway. While geometry suggests that the shortest distance between two points is a straight line, this truism often does not see practical application within the markets. Fear and greed, i.e. emotional states combined with leverage, create ebb and flow despite the technical breakout and clear up trend.

The correlation between gold and the gold shares also ebbs and flows. While the historical correlation between the two is strong, fear and greed will stretch it over the short-term. Smart money, possessing the nerve and discipline to act against the consensus, knows that these divergences provide excellent buying opportunities.

The following charts reveal how the correlation between gold and the gold shares breathes over time

Historical Correlation: Gold Stocks and Gold

2009:12


2010:12


2011:04


Best Regards,

Eric

Eric,
I really like your site because no matter what you maintain your bullish position, especially with respect to the miners. I think we're at a critical juncture here once again with the whole sector. I too believe in much higher prices for the metals and I still feel that the mining stocks should be much higher. Recently you did a great piece on the historic undervaluation of the stocks versus the metals themselves. Right now the mining stocks (GDX for example) are riding above a major support line going back from the peak from before 2008. The GDX broke through that level around 54 last year, ran up and hit 64, then got smashed by the shorts down to 53 in January. Now here again, we got another beat down to around 53 again and got support. We are still oversold. I did liquidate some big positions but held core positions. My mistake was getting back in too early, but I'm reloaded now and I still feel that these stocks need to ramp up in a big way. It seems way, way overdue. I like your historical analysis that we could be pushing away from shore after a 30 year consolidation! What I'd like you to do is periodically post the GDX to Gold ratio even more often, especially now as we enter into what could be a huge rally in the shares as I do believe in your "Three taps and out" thesis. Once we get this rally up to 64 in GDX again, and then through that mark as I anticipate, this is where your posting of the ratio will be very helpful as next time I will be selling into that big rally as I would like to miss out on some of these selloffs! It's unbelievable how they can beat these shares down! The manipulation is just crazy. I think that part of this bull market that will drive these shares higher is the day that some of the big ETFs like GLD and SLV start having some big issues that J.S. speaks of in his book. If that happens, it will first and foremost be wonderful but it will also possibly be a key to unlocking the miners into a new phase of their bull market. You've been a great help and I look forward to more great info. Do you think we're on the cusp of the big breakout rally at long last in the shares?
Sincerely,
Noah

Wednesday, May 11, 2011

To Quote A Friend, We’re Nowhere Near a Top in Gold!

While the ebb and flow is becoming more violent in gold and silver, its increasing amplitude does not alter the secular trend.

A parabolic or extended run, like clown at a formal business convention, will be obvious. The acceleration from the primary trend will reveal itself through a statistical ‘spike’. All the chatter about an exhausted parabolic run is unsupported from a long-term, primary trend perspective.

Gold, London P.M. Fixed (Gold) and Z Scores from Primary Trend


Silver, London P.M. Fixed (Silver) and Z Scores from Primary Trend


Gold to Silver Ratio (GSR), Monthly Average Price


Dear Friends,

With gold and silver still recovering, today King World News interviewed the legendary Jim Sinclair. When asked about the volatility in gold and silver Sinclair replied, "The bonds are indicating that the psychology which is most supportive to gold is returning to the market place. And the action in gold after the recent reaction in gold, is so stout, so strong, as is silver itself, so stout, so strong in its recovery, that the only conclusion that you can come to is that we have not established a top in silver and clearly we're nowhere near a top in gold."

Here are a few more snippets from Sinclair's interview:

"The recovery in silver, the fact that it got plowed down, but its character now seems to deny the recent break, I think silver is acting very, very well and as previously stated, I don't believe we've seen a top in silver yet.

When asked about gold specifically Sinclair stated, "$1,764 is calling on gold now and the market is reacting to it. It is calling, it is the magnet pulling most heavily on gold right now."

When asked about the shares Sinclair had this to say, "I know what kind of money these companies are going to make. I understand what kind of cash flow that can be generated from this type of price on gold. There is no way on earth at this point that the hedge funds (short miners) are going to be correct. In fact they are the ostriches with their heads in the sand. No share will remain under pressure of a hedge fund when it begins to put out the type of cash flow that the price of gold now will result in."

From Jim Sinclair.

Click here to read the rest of the written interview and listen to the verbal interview on KingWorldNews.com...

Source: jsmineset.com

Thursday, May 5, 2011

There Are Many Parabolic Trends Within A Secular Trend

The explosive nature of silver is whipping around retail money like a plastic bag in a strong wind. While the headlines have been citing silver an unsustainable, parabolic trend, they do so from a short-term perspective. ‘Parabolic’ has the Street’s darling adjective used to describe silver. Life is about fractal analysis. Parabolic in terms of months versus years are two different trends. For example, the impressive advance from 1976 to 1980 in silver (and gold), the thick green parabola superimposed on 2008 for purpose of comparison, provides a completely perspective to the term parabolic.

The movement of money during the decline will reveal a better picture of the convictions behind silver and gold.

Silver, London P.M. Fixed (Silver) and Z Scores from Primary Trend

Gold Shares: Pessimism + Strong Tape = Accumulation Setup

Morning Observations:

(1) Retail money and headline analysis reflects pessimism towards the sector.
(2) REV(E), trend/tape energy, soaring to new highs while price lags.
(3) Observation 1 (Pessimism) + Observation 2 (Strong Tape) = Accumulation Setup. This classic setup often precedes the transition from “cool” to “hot” market.

Acting with discipline is not easy.

Eric

Gold Miners Index ETF (GDX):

Monday, May 2, 2011

Gold to Silver Ratio (GSR)

Morning Observations:

(1) Critical support tends to be tested as resistance.
(2) Silver has become an explosive market.
(3) The lower magnet is not done pulling.

Gold to Silver Ratio (GSR), Monthly Average Price:

Friday, April 29, 2011

Does A Rising Trend Suggest Real Estate Is Prospering?

No.

A rising nominal trend does not necessary suggest prosperity during periods of aggressive currency devaluation. Dow Jones Equity REIT to Gold ratio, the true message of the market, suggests replacing prospering with struggling. Smart money never shorts an asset denominated in devaluing currency without a hedge. In other words, short the weak asset and buy the strong. There’s no better hedge for currency devaluation than gold.

DJ Equity REIT to Gold Ratio:


This is what "Smart Money" is doing, who would have thought anything Real estate could be prospering? another question for how long ?

another question is "how smart am I", I would have shorted this a long time ago and lost the jewels, another question "how smart is smart money?

Bob

Real Estate iShares (IYR)

Chart: stockcharts.com

Thursday, April 28, 2011

What's To Decide?

Below is classic retrospective analysis that tends to favor indecision. Liquidity, provided by currency devaluation, is driving stocks as well as many other assets higher. This continues until the next hemorrhage phase. Hemorrhage phases, or contractions in liquidity and confidence, tend to be ‘anticipated’ by an increasing number of divergences of price relative to the trend, market participation, and money flows.

Headline: Decision Time for Stocks

In normal times, when a market stalls at a price level and finally punches through, it is known as a technical "breakout." Demand is able to absorb all supply thrown at it, and then some; simple economic theory tells us prices should move higher.

The problem is that this sort of textbook analysis has not been working for months and arguably since the financial crisis blew up in 2008. Now with the Standard & Poor's 500 index poking its head above recent highs, we have to wonder if we are about to be faked out once the market digests Federal Reserve Chairman Ben Bernanke's press conference comments Wednesday.

Last month — just before the Japanese disaster — the S&P 500 made a classic move below the rising trendline that supported it for six months. Four trading days after the Japanese tsunami, the market reversed to the upside. A breakdown was negated.

Source: finance.yahoo.com

Wednesday, April 27, 2011

Liquidity Lifts All Boats

Liquidity lifts all boats. Some boats rise faster than others. At times I wonder if anyone other than Jim and Dan can recognize a parabolic trend? “Bubbly”, a term often used to describe the action in gold and silver by the media, has a distinct feel and a unique mathematical footprint.

Gold, London P.M. Fixed (Gold) and Z Scores from Primary Trend


Silver, London P.M. Fixed (Silver) and Z Scores from Primary Trend


Headline: Silver Rush Spreads to Stock Market

The mania for silver has spread to the stock market as day traders pile into the buying.

Trading got so heated during the past two days that shares traded in the iShares Silver Trust, the biggest exchange-traded fund tracking the price of silver, topped that of the SPDR S&P 500 ETF, usually one of the most actively traded securities in the world.

Day traders "are going crazy," says Joseph Saluzzi, co-head of trading at brokerage firm Themis Trading. "It's typical of the bubbly speculation that's been going on in silver."

On Monday, trading in the silver ETF was especially heavy, as silver prices soared to new 31-year highs and approached $50 an ounce. Silver is up 46% this year, part of a nine-month rally. The heavy ETF trading continued on Tuesday, as silver prices retreated.

Source: finance.yahoo.com

Case Says U.S. Housing Already Experienced `Double Dip'

The trends illustrated below support Karl Case's growing concern about real estate.

U.S. Median Home Price (MHP) And MHP to Gold Ratio:


S&P Homebuilders Index (HB) AND HB to Gold Ratio:


S&P Homebuilders Index (HB) AND HB to U.S. Median Home Price (HBMHPR):


Bottom line, QE will continue either direct or indirect despite the talk of withdrawal.

Economist Karl Case:

'In a sense, We've already had a double-dip [in housing].'

'We've always been able to count on new households coming into the market; they're not coming.'

'There's going to be a lot of dislocation when Fannie and Freddie evolve into something new.'

'Housing starts are at sixty-year lows, and they've been there for 33 months.'


From Bob

Tuesday, April 26, 2011

Constant Currency Dow Transportation Better Represents the 'Real' Economy

Higher stock prices, driven by liquidity (currency devaluation), support the premise of a solid economic recovery. The transportation stocks (transports), like small cap stocks, have always been more sensitive to liquidity. The computer buy programs will chase even harder when the transports push to new highs in the near future. New nominal highs, however, means little in a world driven by currency devaluation. The downward trend in the constant currency transport index provides a better assessment of the 'real', clearly struggling economy.

Dow Jones Transportation Average (DJTA) AND DJTA to Gold Ratio (DJTAGOLDR):

Monday, April 25, 2011

Silver and US Long Bonds Markets

Silver, despite the hype generated by price action, is not the market of all markets. It is simply a market under ‘control’ strain. There is only one phrase that characterizes this market – sh*t is a changing. The old setup of shorting strength to control the advance has been disrupted. This is why silver has become an explosive market.

Silver (SLV) and the Commercial (C) Less Nonreportable (NR) Traders COT Futures And Options Stochastic Weighted Average of Net Long As A % of Open Interest:


All markets are interconnected/interrelated to some degree. Variances in timing may give the impression that one market is more important than another. It’s this difference in timing (phase of the debt crisis) that makes the bond market extremely interesting right now. Building a position (long or emphasis on short) through patience and timing is a critical part of investment discipline.

US Treasury Bond 20YR+ (TLT) And Bond Diffusion Index (DI):

What's Driving Equities?

Liquidity!

The bullish divergence in internal trend energy suggests new nominal highs in stocks in the near future.

NYSE Internals:


New nominal highs in stocks, however, illustrate neither a bull market nor economic recovery. The real (constant currency) turns illusion into reality. The real trend reveals the role of liquidity (currency devaluation) in fostering the perception of a bullish outcome.

U.S. Large Cap Stocks Capital Appreciation Index (LCSCAI); S&P 500 to Gold Ratio and Z Scores from Primary Trend

Thursday, April 21, 2011

Early Stage Trend Acceleration in Gold, Silver, and Gold Shares

While the recent moves in gold and silvers have been impressive, they remain well within historical norms of an accelerating trend.

Silver, London P.M. Fixed (Silver) and Z Scores from Primary Trend


Gold, London P.M. Fixed (Gold) and Z Scores from Primary Trend


When coffee houses are filled with discussions of gold, silver, hidden gold mine “gems” that Mark Twain would characterize as liars standing next to hole in the ground, the parabolic move will be near exhaustion. The general under performance or lack of interest in the gold shares in the face of gold and silver strength suggests early stage trend acceleration.

S&P Gold (Formerly Precious Metals Mining)*
*S&P Gold from 1945, Barron's Gold Stock Index from 1939-1945, 1922-1939 Homestake Mining


Headline: Jim Rogers Says All Parabolic Moves End Badly, Gold and Silver Not Yet in a Bubble

Legendary global investor and chairman of Singapore-based Rogers Holdings, Jim Rogers warned that if silver continues to go up like it has been over the past 2 or 3 weeks and reaches triple digits in 2011, he will probably start to think about selling because then 'you've got a bubble'.

Speaking to Financial Survival Radio, Rogers said: " My hope is, silver and gold and all commodities will continue to go up in an orderly way for another ten years or so, and eventually the prices will be very, very high".

"I hope something stops it going up in the foreseeable future and we have a correction," he added.

Source: lewrockwell.com
Quiet Acumulation of Gold Shares Since 2009

Yesterday I discussed Goldcorp's (GG) building trend energy as representative of the setups within the gold mining space. The gold miners index ETF, a composite of many of the high-quality names in the sector, illustrates the depth of this setup within the sector.

The positive divergence of trend energy with price (new highs while price lags) reveals accumulation. In other words, Capital has been quietly accumulating into weakness, likely at the expense of retail money, since 2009. This positive divergence is as pervasive in juniors as it is the majors.

MV Gold Miners Index ETF (GDX):

Wednesday, April 20, 2011

Follow The Money

The zombie logic provided by the mainstream headlines obscures an understanding of reality provided by following the money. Follow the money is probably the most important and discussed concept on Insights.

Markets At A Glance: Follow The Money

What the so-called silver ‘experts’ neglect to account for in their models and projections is that the fiat money experiment has failed. And in this context, we believe the Market has assigned world reserve currency status to gold - not USD, not EUR, and not JPY. In our opinion, gold’s continued appreciation vis-à-vis every currency is assured because the great flight from fiat has only just begun. Like gold, silver also has a long monetary history, and as such, investors are now also buying silver as protection from the ravages of fiat currency debasement. Yet, when compared to gold, it is silver that offers the most attractive value proposition by virtue of the gross mispricing of its scarcity, which, we might add, has existed for many years. Thus, in our opinion, as this new bimetallic standard takes root, silver investors will continue to be justly rewarded with marked outperformance. We truly believe that this is the investment opportunity of a lifetime, and increasingly so, others are taking heed. What is clear to us is that with equal investment dollars now flowing into silver and gold, the current 35-to-one ratio is unsustainable and has only one direction to go: lower.


Eric Sprott clearly understands the message of the markets.

Gold to Silver Ratio (GSR):


Source: sprott.com