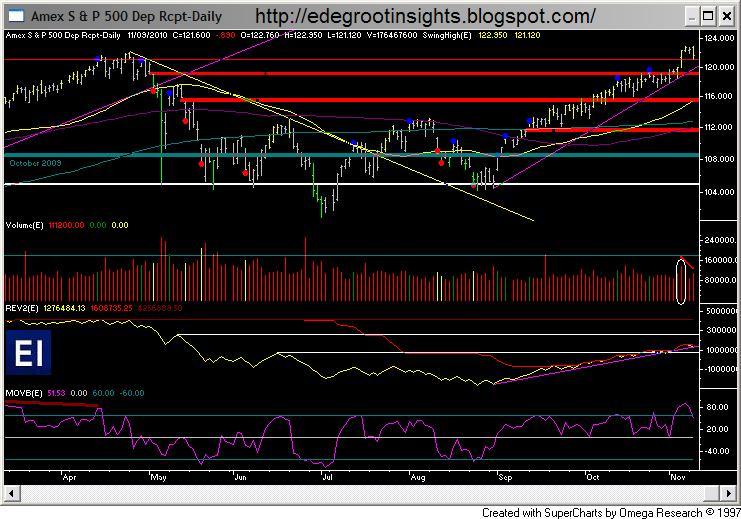
The S&P 500 broken above the April resistance zone on 11/04. This was confirmed by a surge in NYSE volume. Today’s decline in stocks, accompanied by large intraday declines in gold and silver, retested what was once resistance as support. The contraction in volume suggests that resistance has become support.
S&P 500
A breadth indicator called ADN(E), a special adjusted breadth measure, lead the market to higher highs in October. ADN(E) has registered a higher high in November. This suggests that the NYSE “soldiers”, as opposed to limited participation from the “generals” only, are leading the market. Broad market participation reflects a strong uptrend.
NYSE Breadth

It is also important to remember that connected money remains aggressive net long. Don't expect them to stand up and vocalize their positions to support you through volatility-induced fear.
S&P 500 and the Commercial Traders COT Futures and Options Stochastic Weighted Average of Net Long As A % of Open Interest:

0 comments:
Post a Comment