Thursday, December 31, 2009

Stocks fall sharply as investors close out 2009

The stock market closed out a remarkable 2009 with a loss as investors bet the improving economy will lead the government to pull back on its stimulus measures.

Let's examine the above logic.

Define improving economy here. Core business spending is at best flat-line when adjusted by the understated CPI and declining in gold/stable currency terms.

Source: http://business-money-and-finance.blogspot.com/2009/12/us-economy-orders-claims-signal.html

While real consumption's contraction is slowing, it is still declining in real terms. That's a big deal as consumption contributes over 70% of U.S. Gross Domestic Product (GDP).

Moreover, the minute the government begins to withdrawal it's stimulus measures, the consumption-driven economy will roll over under the force of debt implosion. It is the stimulus (government spending, bailouts, liquidity injections) at the expense of the currency that is pushing up the stock market. Food stamp holders, or today's bread lines will only increase with the removal of stimulus. This is not a politically viable option. Thus, the ever increasing threat of a hyperinflationary depression as most notably discussed by Jim Sinclair and John Williams.

Source: http://business-money-and-finance.blogspot.com/2009/12/shadowstats-john-williams-prepare-for.html

Hyperinflation and depressions are not mutually exclusive as many think. History is riddled with economic decay driven by currency collapses. The most notable is the Wiemar Republic.

Source: http://business-money-and-finance.blogspot.com/2009/12/squawk-box-financial-summit-markets.html

The recent discussions about the need for a equity correction in 2010 on F-TV has many investors worried. As my shades of 1932 commentary illustrated, time is still wrong. The 1932-1933 and 1974-1976, both comparable, gold-adjusted counter-trend rallies, last 15 months and 21 months, respectively. The 2009 rally is a mere 9 months old. Need for a correction? Yes, but time still wrong.

Source: http://business-money-and-finance.blogspot.com/2009/12/shades-of-1932.html

Or, simply follow Jim's advice:

Why short this mess in the banksters sh*t hole when you can own gold?

Can't argue with that.

Happy New Year to all!

Source: http://finance.yahoo.com/news/Stocks-fall-sharply-as-apf-636450788.html?x=0&sec=topStories&pos=main&asset=&ccode=

Source: http://finance.yahoo.com/news/Few-called-market-turn-fewer-apf-2058839167.html?x=0&sec=topStories&pos=2&asset=&ccode=

TA Spotlight: Long Bond

All through time, people have basically acted and reacted the same way in the market as a result of: greed, fear, ignorance, and hope. That is why the numerical formations and patterns recur on a constant basis. - Jesse Livermore.

End of the year interpretations are always difficult as shrinking volume can exaggerate moves. The long bond market, nevertheless, requires attention as price approaches the neckline of the large head and shoulders pattern. The weekly chart reveals the size of the pattern. The greater the size, the greater energy released in terms of downside price action if the neckline swing low fails.

The daily chart reveals the details of the recent deterioration in price. Again, volume is the key. It needs to pick up to create enough energy to break the neckline swing lows.

TA and money flows* suggest that stakes are very high.

Long Bonds TLT ETF Weekly:


Long Bonds TLT ETF Daily:


* Further discussion of long bond money flows:
http://business-money-and-finance.blogspot.com/2009/12/cot-money-flows-custers-last-stand-in.html

U.S. Jobless Claims Drop to Lowest Level Since 2008

Fewer Americans than anticipated filed claims for unemployment benefits last week, pointing to an improvement in the labor market that will help sustain
economic growth next year.

Initial claims rise unexpectedly, then they fall unexpectedly. Measuring strength or weakness from deviations from expectations is a complete waste of time. Who sets the expectations? Direction and rate of change of the direction of the trend, not deviations from expectations, drive economic consensus. As trillions of dollars are injected into the economy, initial claims, naturally, have begun to decelerate. The dominant trend, however, remains up. When the debt-fueled injections do little to spur investment, the necessary driver for future economic growth, the trend deceleration will turn to acceleration in 2010-2011.

Further review of the average weekly initial clams: http://business-money-and-finance.blogspot.com/2009/12/new-jobless-benefit-claims-rise.html

Source: http://www.bloomberg.com/apps/news?pid=20601087&sid=aEKR_k1fXbgM&pos=1

Wednesday, December 30, 2009

Tracking the Nation's Failed Banks


Click link to activate: http://s.wsj.net/public/resources/documents/info-Failed_Banks-sort.html

Govt gives GMAC $3.8 billion in new aid

The government on Wednesday provided a fresh $3.8 billion cash infusion to stabilize GMAC Financial Services as the financing company struggles with hefty losses in its home mortgage unit.

The fresh infusion is on top of $12.5 billion in taxpayer money Detroit-based GMAC has already received from the government. The new agreement will boost the federal government's ownership in GMAC to 56 percent, from 35 percent.

More infusions as the initial estimates, a real shocker, prove to be too small.

Source: http://finance.yahoo.com/news/Govt-gives-GMAC-38-billion-in-apf-2375173642.html?x=0&sec=topStories&pos=6&asset=&ccode=

Devaluation's effect on coinage

Why is point lost on all but coin collectors?
When Nero debased the silver standard of Rome, he did not simply clip the coins. He left the denarias pure silver on the outside, and copper/silver inside. He hid his activities much like the fact that we are not to know what took place in the bailout of the financial industry.

Simply review the coinage history of the United States. Gold & silver were once highly concentrated in our coinage. After 1933, gold was removed. After 1964, silver was completely removed in nearly all coinage. After 1970, silver content was removed from all coins and replaced with copper/nickel clad. After 1982, copper pennies became mostly zinc. Recent coin introductions include a mixture of zinc/copper/magnesium/nickel. What's next?

As currency devaluation intensifies, it gets harder and harder to find an alloy mixture in which the face value is greater than the intrinsic melt value. This in large part explain the growing push for a credit or cashless society.

US moves to place new duties on steel from China

The U.S. government is imposing new duties on imports of steel pipes from China, the latest sign of trade tensions between the two countries

Duties - Tarriffs, same difference. Beggar thy neighbor policy where one country seeks to gain benefit at the expense of others.

Smoot–Hawley Tariff Act

The Smoot–Hawley Tariff Act of 1930 (P.L. 71-361, sometimes known under its official name, the Tariff Act of 1930)[1] was an act signed into law on June 17, 1930, that raised U.S. tariffs on over 20,000 imported goods to record levels. The ensuing retaliatory tariffs by U.S. trading partners reduced American exports and imports by more than half and according to some views may have contributed to the severity of the Great Depression.[2][3][4]Source: http://en.wikipedia.org/wiki/Smoot-Hawley_Tariff_Act

Source: http://finance.yahoo.com/news/US-moves-to-place-new-duties-apf-3056097711.html?x=0&sec=topStories&pos=4&asset=&ccode=

Talk is cheap, Follow the Money

We still have Faber and Biggs quoted every 20 minutes on F-TV as dollar bulls. F-TV calls this a rally with legs. I respectfully disagree. The rally is a MOPE rally that was decided upon by money managers at many luncheon discussions about the carry trade.

Source: http://jsmineset.com/

A response to Jim,

People talk ad nauseam about trends they cannot change. The trading axiom follow the money was born from this reality. If the dollar rally had legs as suggested by F-TV, why do money flows continue indicate fade rather than support the assertion?

  • Commercial traders have increased their short position as a percentage of open interest (as % OI) to 69% in combined futures and option market as the dollar has rallied. They have decreased their long positions as % OI below 10% into the strength. This is a classic example of fading the rally. The last time commercial long positions as % OI fell below 10% was 02/17/09. The DXY stood at 87.81 on 02/17/09. Three months later the DXY has fallen 82.30. Six-months later, it had fallen to 77.77.

COT F&O Money Flows:

Futher discussion: http://business-money-and-finance.blogspot.com/2009/12/cot-money-flows-custers-last-stand-in.html
  • A rising junior to major gold miners ratio as gold corrects also suggests a fade into strength.
Further discussion: http://business-money-and-finance.blogspot.com/2009/12/ta-gold-miners-follow-money.html

TA: Gold Miners, Follow the Money

All else equal, something not easily said in the mining industry, the junior miners (juniors) tend to carry more leverage, or sensitivity, to the price of gold than the majors. Traders and investors, looking to reduce leverage during gold corrections and become more risk-averse, tend to sell the juniors in favor of the majors. The money flows reverse during price advances. Traders and investors, looking to increase leverage during price advances, tend to sell the majors in favor of the juniors. The junior gold miner’s to gold miner’s (majors) ratio (GDXJGDXR) illustrates the interplay between the two money flows.

In an unusual twist, the GDXJGDXR is advancing rather declining as gold corrects. This suggests increased risk-taking during gold decline. As long as this positive divergence continues, it suggests that money is flowing opposite to the headline, "strong dollar" spin.

Gold Miner's (Majors) Index (GDM):

Junior Gold Miners to Gold Miners (Majors) Ratio:

Tuesday, December 29, 2009

Chinese firm says won't pay Goldman on options losses

A small Chinese power generator on Tuesday rejected demands from a Goldman Sachs unit to pay for nearly $80 million lost on two oil hedging contracts, part of a
long-running dispute over how China deals with derivatives losses.

Source: http://www.reuters.com/article/idUSSGE5BS09T20091229

Shades of 1932

Bottom bouncing is disappointing when you consider the trillions that it cost to get here. This is shades of 1932. - J. Sinclair.

Understanding both time, price and history, deserves a response. He's right, second great depression, circa 1932-1933.

Large Cap Stocks Total Return Index:


Large Cap Stocks Total Return Index to Gold Ratio:


Large Cap Stocks Capital Appreciation Index to Gold Ratio:


Source: http://jsmineset.com/

U.S. Economy: Confidence Rises as Consumers See Brighter Future

Confidence among U.S. consumers increased in December for the first time in three months as companies slowed the pace of job cuts and stocks advanced.

Consumer expectation's or "confidence's" statistical correlation with equity performance is loose at best. Nevertheless, confidence numbers are almost always spun as a short-term equity market driver. A strong, negative correlation does exists between consumer expectations and gold, but this is rarely mentioned or examined. The correlation between consumer expectations and gold from 1968 to 1980 was -0.67. Since 2000, the correlation between consumer expectations and gold is -0.76. Confidence ebbs and flows during gold bull phases. The greater the flow during periods of spin-induced hype, the greater the ebb when reality returns.

University of Michigan Consumer Expectations and Gold:


Source: bloomberg.com

Morgan Stanley sued over failed $1.2 billion CDO

Lawyers will finish off what the market started.

Source: http://finance.yahoo.com/news/Morgan-Stanley-sued-over-rb-3965872518.html?x=0&sec=topStories&pos=4&asset=&ccode==

TA: Tanzanian Royalty Exploration Corp (TRE)

Technical formations are often a function of threes. "Three drives to a Top" and Three Taps and Out are technical heuristics that represent the interaction between price and volume.

Three Drives to a Top: DXY


While support and resistance zones are set by price, they are controlled by volume. Volume, the fuel or kinetic energy that drives the trend, is often foolishly ignored or overshadowed by price.

The volumes which we have been discussing are least liable to mislead when manipulation prevails, for the manipulator is obligated to deal in large blocks of stock, and must continually show his hand. A complete manipulative operation on the long side consists of three parts: (1) Accumulation, (2) Marking up, and (3) Distribution. In the case of a shorting operation -- the distribution comes first, then the market down and the accumulation. -- Richard D. Wyckoff

TRE are is nearing completion of three taps and out of Barron's gap resistance (reference of Barron's gap: http://jsmineset.com/.). Volume was strong during the gap formation, likely the last stage of the mark down in size, so the energy required to break it must be equally strong during accumulation. A breakout can come with two types of confirmation. A sign of strength, or volcanic energy release, which is characterized by a price jump of resistance on heavy volume. The other is slow and steady bulldoze similar to the force within a glacier. Time and energy eventually crushes the resistance into submission.

The US dollar and Gold-Adjusted TRE charts suggest that the mark down phase is nearing an end.

Three taps and out: TRE

TREGLDR

Monday, December 28, 2009

COT Money Flows: Custer's Last Stand in the Bond Market?

The commercial traders continue to quietly increase their short positions as the world recognizes a "crowded dollar trade." ....

Rather than rehash, please review the following editorial:
(http://business-money-and-finance.blogspot.com/2009/12/gold-bears-fear-is-contagious.html).

Commercial traders continue to take the opposite side of the "crowded dollar trade." Time window is open and the money is setting up.

COT Money Flows:


COT F&O Commercial US Dollar Money Flows:


COT F&O Nonreportable US Dollar Money Flows:


Custer's last stand in the bond market? This could very well be "the battle" that defines the coming decade.

COT F&O Commercial Long Bond Money Flows:

Gold Bears: Fear is Contagious

"Some pro-gold stars like Mark Faber and Jim Rogers are being interviewed every day and are predicting a dollar rally. That is scary to those that have followed them and is making them emotional."

Fear is contagious. As such it is dangerous.

There's plenty of coverage on Jim Roger's short term bet on the dollar. This triggers the fear. Rogers also admits within the context of the bet that he's a horrible short-term trader and will most certainly lose money on it. The following video discloses this piece information:

Video (6:53 into the video): http://www.youtube.com/watch?v=ObVBCHBcQfA&feature=PlayList&p=0AEB0B43B7790A69&playnext=1&playnext_from=PL&index=32

Spin embraces only pieces of information and limited perspective. It usually presents them to generate an emotional response. Sell or buy everything now! Often the emotional response runs contrary to the actions of those generating the spin. For example, the commercial traders continue to quietly increase their short positions as the world recognizes a "crowded dollar trade." They also do this as the window of time for the resumption of the decline opens. This makes the quiet money flows even more salient.

Source: http://jsmineset.com/
Source: http://bloomberg.com/apps/news?pid=20601087&sid=adJ8VOJxxzzQ&pos=6
Source: http://www.bloomberg.com/apps/news?pid=newsarchive&sid=aNWi40L8nVrw

Oil jumps above $79 a barrel

OSX to XAL ratio has once again entered the lower band of the 1999 trading channel. Unless the trading pattern is decisively broken to the downside, an indication a fundamental change, either supply/demand, currency-related, or combination of the two, the lower band of the trading channel has consistently marked inflection points in the oil market since 1999. This intermarket relationship warrants some attention going forward.

OSX to XAL Ratio:

Anticipation is much harder than reaction as it requires patience and discipline.

Source: http://finance.yahoo.com/news/Oil-jumps-above-79-a-apf-2129866930.html?x=0

Sunday, December 27, 2009

Central Banks Avoiding Dollar to Kill 2010 Rally, Barclays Says

Dec. 24 (Bloomberg) -- The U.S. dollar’s gains may end in the middle of 2010 as central banks shy away from adding greenbacks to their reserves and the Federal Reserve raises rates at a slower pace than investors expect, Barclays Plc said.

May end in the middle of 2010 as central banks shy away from adding greenbacks to their reserves? Central banks are shying away right now.

The U.S. dollar index has generated two down legs since 2002. There were 138 and 126 weeks in duration. The last counter trend rally topped out on 3/17/09. This places the duration of the current down leg at 40 weeks. Time is still wrong. As spin supports continuation of the rally, the commercial traders quietly fade strength (http://business-money-and-finance.blogspot.com/2009/12/dollar-strength-seen-in-stocks-1st.html)

Source: http://www.bloomberg.com/apps/news?pid=20601103&sid=a9vtCAwBPV_E

Saturday, December 26, 2009

U.S. Economy: Orders, Claims Signal Confidence Rising

“Business spending, after a long recession hiatus, is staging a comeback,” said Ken Mayland, president of ClearView Economics LLC in Pepper Pike, Ohio. “Payrolls were cut too deeply over the last year, and hence, there will be a need to rehire to some degree.”

Granted, business spending is staging comeback in U.S. dollar or nominal terms from extremely depressed levels. Business spending adjusted for inflation (CPI) and currency devaluation (GOLD), however, suggest more of a continuation than a comeback. From this perspective, the economic comeback so highly touted on F-TV et. al. can only be described as tepid at best. The figurative description as the peanut brittle recovery by Jim Sinclair is most apropos.

Real (CPI-adjusted) Core Business Spending:

Gold Adjusted Core Business Spending:


Source: http://www.bloomberg.com/apps/news?pid=newsarchive&sid=aO3vrsnMw7hQ

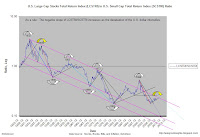
U.S. Small Cap Stocks Analysis

Long-term historical trends in U.S. small cap stocks. History is an excellent teacher.

U.S. Small Cap Stock Total Return Index:

U. S. Small Cap Stock Total Return Index to Gold Ratio:

U.S. Small Cap Stock Total Return Index to U.S. Large Cap Stock Total Return Index:

Stadium Boom Deepens Municipal Woes

Mortgage owners weren't the only ones sold the plateau of prosperity in recent years. The stadium boom was also structured on unrealistic expectations. Structured expectations that once smashed by economic reality served only to increase the taxpayer burden and punch holes in local and state budgets. Another example of the "Formula" at work.

In 1996, voters in Hamilton County approved an increase of half of one percent in the sales tax that promised to build and maintain stadiums for the Bengals and the Reds, pay Cincinnati’s public schools and give homeowners an annual property tax rebate. The stadiums were supposed to spur development of the city’s dilapidated riverfront.

But sales tax receipts have fallen so fast in the last year that the county is now scrambling to bridge a $14 million deficit in its sales tax fund. The public schools, which deferred taking their share for years, want their money.

Source: http://www.nytimes.com/2009/12/25/sports/25stadium.html

Source: http://jsmineset.com/

Treasury removes cap for Fannie and Freddie aid

Infinite QE under the policy of "too big to fail."

"The companies are nowhere close to using the $400 billion they had before, so why do this now?" said Bert Ely, a banking consultant in Alexandria, Va. "It's possible we may see some horrendous numbers for the fourth quarter and, thus 2009, and Treasury wants to calm the markets."

Source: http://news.yahoo.com/s/ap/20091225/ap_on_bi_ge/us_mortgage_giants_ceos

Thursday, December 24, 2009

Long Bonds

End-of-the-year, holiday trading sessions tends to be thin. As a result, any interpretations made from price and volume are often inconsistent at best. With that said, it is important to note that the price and volume action in the double inverse long bond ETF (TBT) suggests a breakout of the short-term head and shoulders bottom. The 12/11/09 swing high was exceeded on increasing in volume despite holiday conditions. This bullish setup warrants close scrutiny as it implies the following: (1) Higher yields, and (2) a retest of the larger, more significant head and shoulders formation and 1982 trendline over the short- to intermediate-term.

The 30-yr yield and Long-Term Government Bond Total Return Index charts illustrate why the bond market has become the canary in the coal mine. The bear's growl is intensifying.

Stay tuned.

TBT:

30-YR Yields:

LTGBTRI:

Senate Passes Measure to Overhaul Health-Care System

The Senate voted 60-39, with all Democrats and two independents backing an $871 billion measure that would extend coverage to tens of millions of uninsured Americans. Republicans opposed the legislation, saying it would raise taxes, widen the federal deficit and hurt private companies such as Hartford, Connecticut-based Aetna Inc.

If this bill passes into law, it will certainly carry consequences reflected by the "The Formula". The formula, in turn, influences the exchange value of the currency.

Formula:

Leading Formula:

Source: http://bloomberg.com/apps/news?pid=20601087&sid=ayB9oSHIQYwM&pos=8

Source: http://jsmineset.com/

Schwarzenegger Seeks Obama’s Help for Deficit Relief

Schwarzenegger, a Republican, plans to ask for relief totaling as much as $8 billion, according to a California official who asked not to be identified because details haven’t been resolved. Instead of seeking one-time stimulus money or a bailout, the state wants the U.S. to reduce mandates and waive rules stipulating minimum expenditures on programs such as indigent health care, the official said.

While the focus is on Greece and trouble in the EU, it could very well be on California and trouble in the US Union.

Source: http://www.bloomberg.com/apps/news?pid=20601087&sid=a8IKZdXgVszQ&pos=2

Wednesday, December 23, 2009

Flaherty Says Russia, China May Buy Canada Dollars

“It does not surprise me that China and Russia would take greater positions in the Canadian dollar than they have previously,” Flaherty, 59, said during an interview in his office in Ottawa. “I would expect countries looking around the world to invest in market currencies that are reliable.”

Would take? How about already taken.

Source: http://www.bloomberg.com/apps/news?pid=20601082&sid=aRdBXJxHy6tA

Sales of U.S. New Homes Unexpectedly Fell in November

“The tax credit put a Band-Aid over the housing problem and in October and November we ripped it off” as it was set to expire, said Mark Vitner, a senior economist at Wells Fargo Securities LLC in Charlotte, North Carolina, who projected sales would fall. “Demand for housing is not likely to pick up on a consistent basis until we start to see some improvement in employment.”

Record foreclosures are also restraining housing by driving down prices.

The median home price to gold ratio (MHPGOLDR) removes the influences of currency devaluation on home prices. When home price trends are studied in terms of stable currency such as gold, it suggests that further deterioration in the coming years. The 1979 and 1983 gold adjusted price magnets are pulling hard.

MHPGOLDR:

The median home price to months supply ratio (MHPMSR) suggests that even without acknowledgement of the shadow inventory of foreclosed homes price will continue to struggle with overhead supply.

MHPMSR:

Source: http://www.bloomberg.com/apps/news?pid=20601087&sid=a4.G0b6mel5A&pos=1

Gold to Silver Ratio:

The Gold and Silver ratio (GSR) represents an excellent risk aversion to risk-taking ratio. GSR trend changes often lead trend changes in the equity market.

Gold to Silver Ratio:

Large Cap Stocks Capital Appreciation Index:

Tuesday, December 22, 2009

Top hedge funds bet on big yields rise

“It will be difficult for the government to withdraw the economic stimulus,” Mr Paulson said in a speech. “An increase in the monetary base leads to an increase in the money supply, which leads to inflation.”

This is the same Paulson that plans to invest heavily in gold and gold shares.

Nov. 18 (Bloomberg) -- Paulson & Co., the hedge-fund firm run by billionaire John Paulson, is starting a gold fund that will invest in mining companies and bullion-related derivatives, a person familiar with the plan said.

Source: http://www.ft.com/cms/s/0/e590e35e-ef45-11de-86c4-00144feab49a.html?nclick_check=1

Source: http://www.bloomberg.com/apps/news?pid=newsarchive&sid=acZn2mPCf8Ag

Housing Sales & GDP Reports

The headlines were filled with accounts of soaring home sales and strengthening recovery after the homes sales and GDP reports. For a moment, let's not question the integrity of the reported data but rather examine the importance of housing and the balance within GDP.

Spin suggests that a strong housing market is essential for a strong recovery. Residential fixed investment accounts for less than 5% of GDP on average since 1947. It's importance to the recovery is more a function of it's ability to support bad debt and encourage further debt-based consumption through leverage. Personal consumption as a percentage of GDP, however, is already above 71%. This is the highest reading since the consumption bubble started in 2000-2001. Furthermore, cash hoarding banks continue to show reluctance to lend. In other words, growth of GDP will likely have to come from other components.

PCE%GDP:
.

Gross domestic private investment, or investments in assets necessary to expand future GDP, continues to contract at an alarming rate.

GDPI%GDP:


Since trade deficit is structural problem, expect no long-term help without significant (re)investment.

NETX%GDP:


The solution, unfortunately, will be increased government spending and investment. History suggests that this solution will not provide a solid foundation for a sustainable recovery.

GCEI%GDP:


Source: http://finance.yahoo.com/news/November-home-sales-soar-74-apf-1426453664.html?x=0
Source: http://finance.yahoo.com/news/Recovery-likely-strengthening-apf-2679594626.html?x=0

The Dollar and Gold in 2010.

The average man doesn’t wish to be told that it is a bull or a bear market. What the desires is to be told specifically which particular stock to buy or sell. He wants to get something for nothing. He does not wish to work. He doesn’t even wish to have to think. ~ Jesse Livermore.

Livermore insights reminds us why spin, MOPE, propaganda, etc works so well to shakeout the weak hands during market operations. Those without understanding will never have the discipline to withstand the attacks from those that do. You must endeavour to understand the fundamentals driving the markets to remain committed during the periods of spin-induced doubt. Nothing has changed. The dollar rally has no legs because the fundamentals and time (dollar-strength-seen-in-stocks-1st.html) do not support it.

Banks with political ties got bailouts, study shows

U.S. banks that spent more money on lobbying were more likely to get government bailout money, according to a study released on Monday.

Total Deposits for Four Top Banks:


The sharks continue to get bigger by design. Consolidation and control.

Source: http://www.reuters.com/article/idCNN2124009320091221?rpc=44
Source: http://cop.senate.gov/documents/cop-120909-report.pdf

Dollar and Long Bonds

Volume continues to shrink within gap resistance. This suggests upside force is waning.

UUP (U.S. Dollar Index ETF):


Swing high breached with volume confirmation despite the pre-holiday session. This implies lower bond prices or higher yields over the short-term. The intermediate-term magnets as illustrated in the Shearson T-Bond Long-Term Price Index are pulling hard. The long bond market warrants close attention.
http://business-money-and-finance.blogspot.com/2009/12/ta-long-bonds.html

TBT (2x Inverse Long Bonds ETF)

Monday, December 21, 2009

Dollar Strength Seen in Stocks 1st Since Lehman Died

The dollar is rallying in tandem with stocks and commodities for the first time since before Lehman Brothers Holdings Inc.’s bankruptcy last year sparked the financial crisis, signaling the worst may be over for the greenback.

We are witnessing a watershed shift in sentiment regarding the dollar.

The forex market will anticipate the Fed tightening and price it into the dollar, leading the dollar to rally.

Spin will always attempt to cloud reality by manipulating perceptions.


  • Nothing suggests that the inverse relationship between stocks and the dollar since 2001 has been terminated. (See UDX vs S&P 500)

  • While the dollar has rallied above its the 50-day moving average (often cited as an indication of a sentiment shift), it has done so numerous times since 2001. Every move above ended when the weak-hands buying into strength were exhausted by commercial selling. This is happening again right now. (See U.S. Dollar Index COT Money Flows)

  • Probably the most important piece of information is that "time" for a dollar rally is still wrong. Primary down legs in the dollar have averaged 132 weeks since 2001. The current down leg is only 43 weeks old. (See U.S. Dollar Index COT Money Flows)

U.S. Dollar (USDX) vs S&P 500:


U.S. Dollar Index COT Money Flows:


Source: http://www.bloomberg.com/apps/news?pid=20601087&sid=aDJI6N0ZxjxI

Mint reveals how it lost a fortune in gold

Inadvertent slag sales and miscounts lost 17,500 troy ounces? I suppose that's easier than saying we found tungsten/lead filled bars.

More than $3 million in government gold was unwittingly sold off at a fraction of its value as refinery slag, while $8 million more was miscounted and never left the Royal Canadian Mint, the Crown corporation revealed Monday in a full accounting of how it lost track of a fortune in gold for a year.

A series of miscalculations and blunders in the mint's gold refinery dating back to 2005 were responsible for 17,500 troy ounces — a system of weights for precious metals — of gold going missing from the mint's Ottawa inventory count last October, the mint announced in a 12-page report.
Source: http://www.windsorstar.com/Mint+reveals+lost+fortune+gold/2367398/story.html

State and Local Governments Face Crisis

State and local governments from California to New York face significant cash crunches.

California -

"Without additional legislative measures to address the state's financial difficulties or unprecedented amounts of borrowing from the short-term credit markets," the report said, "the state will not be able to pay many of its bills on time for much of its 2009-10 fiscal year."

New York -

Without a budget-cutting plan, state officials said New York may have to delay payments to schools and local governments or borrow to pay its bills, which would hurt the state’s credit rating and its ability to borrow money.

Source: http://statepolitics.lohudblogs.com/2009/11/20/dinapoli-state-cash-crunch-getting-worse/

Source: http://www.sacbee.com/capitolandcalifornia/story/1842247.html

Sunday, December 20, 2009

TA: Long Bonds

TLT price and volume continues to confirm a breakdown of the small head and shoulders formation. The neckline of the large head and shoulders formation and the 1982 trendline as illustrated by the Shearson Bond Index (SLBI) are now pulling hard. This implies upward pressure on yields into 2010. IMO, the bond market remains the canary in the coal mine for the U.S. dollar and other key markets.

TLT:
SLBI:

Failed Bank List Expanding...

While the Fed speaks of removing emergency supports as the economy improves, it quietly ignores the steady stream of bank failures buried in the back sections of the news. One had to search hard to find that the Fed's had to shutter seven more banks on Friday.

Regulators on Friday shut down two big California banks, as well as banks in Alabama, Florida, Georgia, Michigan and Illinois, bringing to 140 the number of U.S. banks brought down this year by the weak economy and mounting loan defaults.

The 140 bank failures are the most in a year since 1992 at the height of the savings-and-loan crisis. They have cost the government-backed deposit insurance fund — which has fallen into the red — more than $30 billion so far this year. The failures compare with 25 last year and three in 2007.

Source: http://www.usatoday.com/money/industries/banking/2009-12-18-bank-failures_N.htm?csp=34
Source: http://www.fdic.gov/bank/individual/failed/banklist.html

Saturday, December 19, 2009

A Consolidation & Breakout Study of Gold

GLD:


Observations:

  • Force of the breakout is a function of time and range (or volatility) within the consolidation. The longer the time of consolidation and greater the volitility within the consolidation, the greater the force of the breakout.
  • The lastest gold breakout occurred after an extremely volatile and long consolidation. To suggest that it has topped out after 3-months and 9% rally from the breakout ignores the massive energy stored within the previous consolidation.
  • Has gold peaked as so many have suggested on F-TV?

Friday, December 18, 2009

COT F&O U.S. Dollar & COT F&O Money Flow Table

U.S. Dollar Index and the Commercial Traders COT Futures and Options Stochastic Weighted Average of Net Long As A % of Open Interest:

U.S. Dollar Index and the NonreportableTraders COT Futures and Options Stochastic Weighted Average of Net Long As A % of Open Interest:

Gold and the Commercial Traders COT Futures and Options Stochastic Weighted Average of Net Long As A % of Open Interest:

Gold London P.M Fixed and the Commercial Traders COT Futures and Options Net Long As A % of Open Interest:

COT F&O Money Flows Table:


Observations -

  • Commercial traders and nonreportables weighted stochastic reveals the continuation of aggressive outflows and inflows during the dollar rally, respectively. In other words, the strong hands have been the sellers and the weak hands have been the buyers. This is a classic bearish setup that awaits a technical sell signal to complete.
  • An overweight COT short position by the commercial traders at the onset rally failed to predict an intermediate top from 2005 to 2006 and 2007 to 2008. Note that the 2007-2008 overweight short position was not as extreme prior to the breakout. The overweight short position from 2009 (October) to 2010 should also fail to predict an intermediate top.

Inflation Expectations are rising

Inflation expectations, as measured by the spread between TIP and nominal bonds, have been rising steadily since March 2009. The government reported CPI is so statistically skewed to understate to be of much historical use.


TIPS to Nominal Bond Ratio: